
Why do Twitter analytics matter?
Why was Freaks and Geeks cancelled after 12 episodes—when the show was clearly just very ahead-of-its-time? Why did they get rid of Pepsi Blue?
The point is, Twitter marketing strategies—just like TV shows and soda flavors—are measured by their success (or lack thereof). If they aren’t working, something must change.
Twitter analytics will let you know if your efforts are paying off, and if they aren’t, they will provide insight into what needs to be improved.
What are Twitter analytics?
Analytics, on its own, refers to data and statistics that gauge the performance of your social media marketing efforts.
What does this look like on Twitter? It’s often represented in likes, Retweets, Tweet impressions, favorites, and replies—most commonly known as engagement. This is an example of the kind of metrics that give you insight on how your social media content is performing.
Benefits of using Twitter Analytics
1. Learn about your audience
The better you know your Twitter audience, the easier it will be to engage them.
Luckily, there’s a wealth of data about the people following you on Twitter. In the Tweet activity dashboard, the Audiences tab gives you a look into demographics, location, and even common interests of those who follow you.
Interests is particularly telling when it comes to what your audience is into, since the categories can get pretty specific:
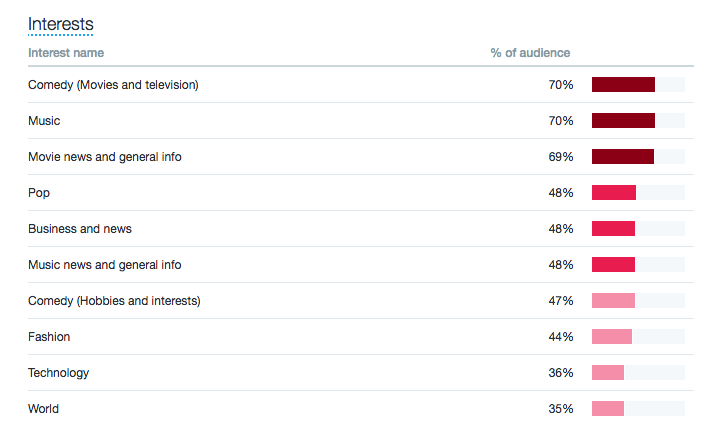
Let’s say 77 percent of your audience is interested in music. This is where you might try to loop in something about what’s currently happening in the music industry and tie that into your next social media campaign.
After all, curating and sharing relevant content with your audience is one of the best ways to boost engagement.
2. Post at the best time
When we say post at the best time, we mean when people can actually see the content you’ve worked so hard to produce. The more people that see your Tweets, the more opportunity there is to boost engagement, drive traffic, and gain potential new followers.
So, how do we figure out the best time to post on Twitter? An important thing to consider is geography.
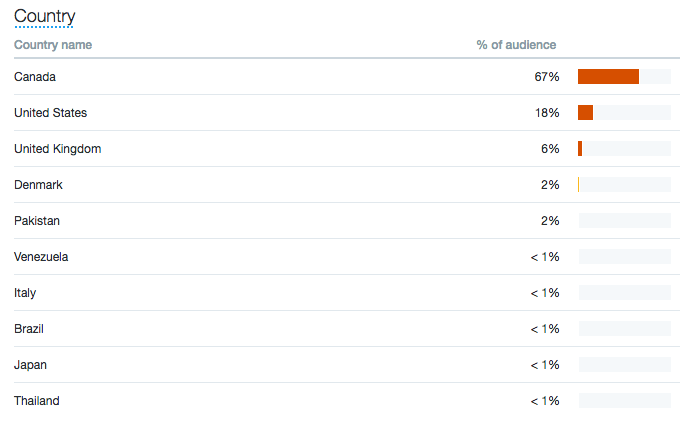
Twitter analytics can show you where the bulk of your followers live around the globe. On the Tweet activity dashboard, this is shown through the Country and Region lists. Once you figure out where most of your audience comes from, you’ll be able to upload content when they’re actually online, and share news relevant to their region.
For more info on when to deliver content, we’ve written about the best times to post on each social network.
3. Replicate your success
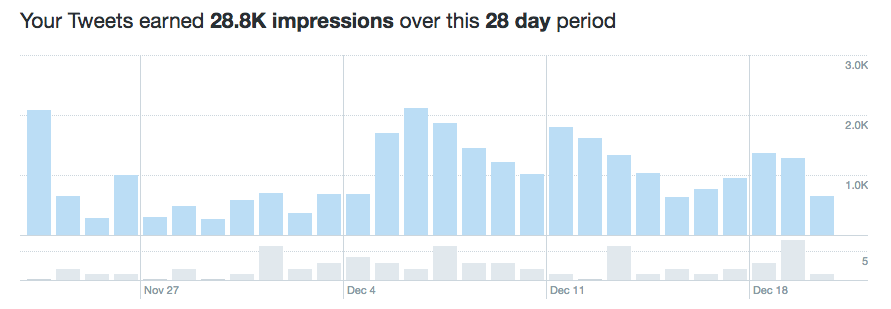
Twitter analytics will show you your top-performing Tweets. More often than not, these metrics are laid out in a bar graph or chart for a simple breakdown. You’ll find an overview with stats on impressions, engagements, and engagement rate.
On the Twitter platform itself, the Tweet activity dashboard offers a look at Tweets that were a hit within the last 28 days, the last week, and in previous months:
Take a long, hard look at the Tweets with a large number of impressions and the most interactions (replies, likes, and Retweets)—these are the ones fuelling the most engagement. This is where you can check for commonalities. What kind of content was each Tweet—image or copy? Was there humor involved? A product review? Were hashtags included? What was the CTA, if there was one?
Analyze the data and use it to create even more engaging content for your audience going forward.
What can you measure with Twitter Analytics?
You can measure a variety of audience actions in Twitter Analytics. Options include:
- Detail expands: How many people clicked on a Tweet to view more details
- Embedded media clicks: How many people clicked on a photo or video in a Tweet
- Engagements: Total number of times a user interacted with a Tweet—clicks anywhere on the Tweet, including Retweets, replies, follows, likes, links, cards, hashtags, embedded media, username, profile photo, or Tweet expansion
- Engagement rate: Number of engagements divided by impressions
- Follows: How many users followed you directly from the Tweet
- Impressions: Times a user is served a Tweet in timeline or search results
- Link clicks: Clicks on a URL or Card in the Tweet
- User profile clicks: Clicks on the name, @handle, or profile photo of the Tweet author
Still stuck? Twitter’s help page will take you through the technical definitions and processes of the analytics dashboard.
Twitter analytics tools
1. Tweet activity dashboard
As mentioned above, the Tweet activity dashboard is available to all kinds of users—individuals, brands, businesses, you name it. Integrated right in the platform, it provides Twitter users with information that can be used to tell how Tweets are performing in terms of engagement, clicks, and more.
2. Hootsuite Analytics
You saw this one coming. While the Tweet activity dashboard is great on its own, Hootsuite Analytics lets you compare the key metrics of all your social media profiles side-by-side. Our analytics tool also lets you build an unlimited amount of reports and will keep tabs on how your team is performing on social media.
Learn how to get even more out of Hootsuite with free social media training from Hootsuite Academy.
3. Tweetchup
Another free Twitter analytics tool, Tweetchup hosts a fun user-interface and allows you to look up any Twitter handle and see their metrics. This is awesome if you’re thinking of doing a bit of competitive analysis.
4. Twitonomy
Twitonomy is a comprehensive Twitter analytics tool that, like Tweetchup, gives you an overview of your competitors and their social media performance—but to an even greater degree. It’s been highly reviewed for being so extensive, as it even lets you backup and export your Twitter interactions into an Excel spreadsheet or PDF file to keep for your records.
5. Tweepsmap
Tweepsmap offers an aesthetically-pleasing visualization of where your followers are located. Illustrated on a world map, this Twitter analytics tool shows you where your audience lives by country, state, or city. Bonus: they also show you the percentage of followers living in each location for an even easier read.

Amazing. Thanks to the creative Tweeps around the globe. #Tweepsmap Get your map too: tweepsmap.com/!BenTrebilcook

Twitter analytics give you insight into how people are interacting with your content, allowing you to optimize your strategy for maximum engagement.
No comments:
Post a Comment